What a weather app does better
A weather app is still the faster way to understand the regional forecast before a trip. It tells you whether a front is expected, what the wind should do, when rain or storms are more likely, and how the broader forecast is evolving through the day. That regional picture matters because pressure alone does not tell you enough about timing, severity, or exposure.
For fishing, that broader view is important before you leave home. You need to know whether the day looks calm, whether a front is due in the afternoon, or whether the session could become a safety problem rather than just a pattern question.
Key takeaways
- Weather apps are stronger for the regional forecast and timing of fronts.
- A barometer is stronger for local pressure history, trend, and trip notes.
- Using both together is more useful than asking either one to explain the entire session alone.
What a barometer adds that forecasts miss
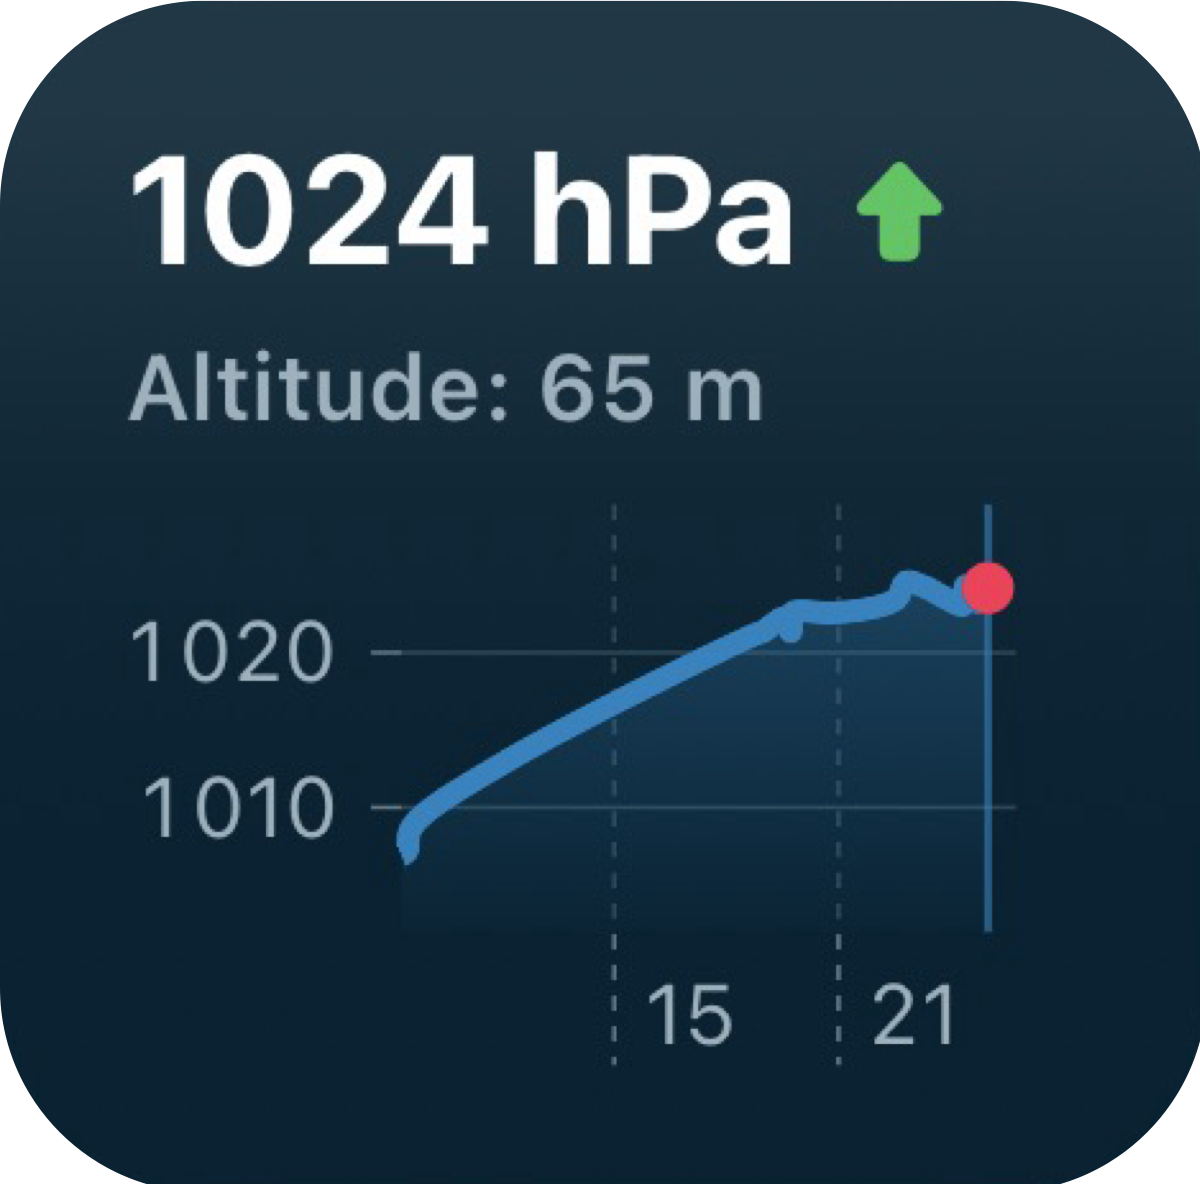
A barometer earns its place because it keeps a local record of barometric pressure near your trip. That matters because forecast language is broad by design. It may describe the area correctly while still missing how quickly the local pressure around your launch or shoreline started moving. The graph turns that local history into something you can compare with what you actually experienced.
That is especially helpful after the trip. You can see whether the best part of the day came during a steady stretch, a pre-front drop, or a rebound after the weather started changing. A forecast app rarely keeps that kind of local, trip-specific memory for you.
Why fishing forecast apps are not the same thing
Many fishing apps promise activity forecasts or bite windows. Those can be interesting, but they often hide too much of the reasoning behind a single score or icon. A barometer is more transparent. It shows the actual pressure trend, and then leaves room for you to compare that with wind, current, season, and what the fish really did.
That transparency matters if you fish the same waters often. Instead of trusting a generalized forecast score, you can compare the local graph with your own notes and see whether certain setups repeat often enough to matter.
The best workflow is forecast plus pressure plus notes
The strongest routine is simple. Start with the weather app for the broader conditions. Check the pressure graph before you leave so you know whether the local setup has been steady or shifting. Then save one or two notes during or after the trip about timing, activity, and the most important condition changes.
That gives you three layers: the forecast, the local pressure record, and your own experience. Together they are much more useful than a forecast headline alone or a barometer graph without context.