What does a barometer measure?
Pressure is force divided by area. Air molecules move and collide with surfaces, and gravity keeps an atmosphere above us. A barometer responds to the surrounding air pressure and expresses it numerically. Although we often describe this as the weight of the air overhead, pressure acts on surfaces in all directions, not only downward.
Traditional instruments use a liquid column or a flexible sealed capsule. Electronic instruments convert the response of a pressure-sensing element into a digital reading. A phone app can display that reading when suitable hardware and system access are available; a city weather page can instead display data supplied by a weather service.
The distinction matters when comparing sources. A downloaded current value may represent a model estimate for a location rather than a measurement made by the device in your hand. Neither becomes an on-device observation simply because it appears on a mobile screen.
Key takeaways
- Barometric pressure and atmospheric pressure refer to the same physical quantity.
- hPa, millibars, and inHg are different units for expressing pressure.
- Elevation and weather both affect a reading; one number alone does not predict rain.
How to read the units
Weather pressure commonly appears in hectopascals (hPa), millibars (mbar or mb), or inches of mercury (inHg). One hPa equals one millibar. Converting between these two labels therefore leaves the numerical value unchanged. Inches of mercury use a different scale: 1000 hPa is approximately 29.53 inHg.
Suppose two displays read 1016 hPa and 30.00 inHg. Those rounded values are broadly consistent, not contradictory. Before diagnosing an app or instrument problem, compare the unit labels and the displayed precision. A whole-number hPa display cannot preserve every decimal shown by another instrument.
The familiar 1013.25 hPa value is the standard atmosphere reference. It is not a required daily reading or a universal dividing line between safe and dangerous weather.
Normal barometric pressure: reference values and high or low readings
Why does barometric pressure change?
Weather systems move and develop, changing the distribution of air in the atmosphere. A regional high has higher pressure than its surroundings; a regional low has lower pressure than its surroundings. These spatial differences help explain weather maps. They are not the same thing as the rise or fall recorded at one place over several hours.
Elevation introduces another change. Moving uphill places less atmosphere above the instrument, so raw pressure generally falls even without a new weather system arriving. A phone taken from a waterfront to a hilltop is therefore not a stationary weather station. Record the movement before interpreting the change as a sign of approaching rain.
Sea-level pressure adjusts for elevation to make comparisons between places more meaningful. It is a calculated value, not a second pressure that the phone directly senses. The adjustment helps comparison, but the altitude estimate and the method used can still affect the result.
A reading, a trend, and a forecast are different
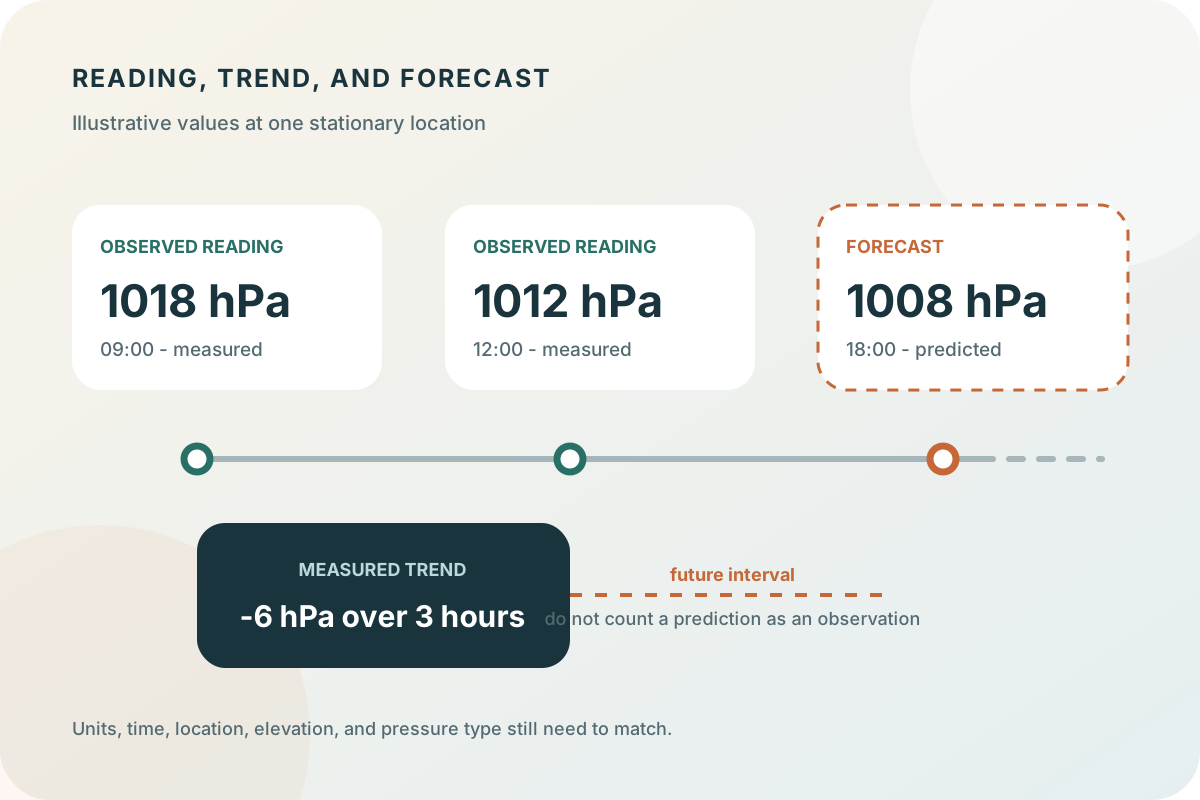
A reading describes pressure at a stated time. A trend describes how measurements change over a stated interval. A forecast describes what a model expects in the future. Keeping those three ideas separate prevents a projected drop tomorrow from being mistaken for a change that has already happened.
For an illustrative example, imagine the same stationary device records 1018 hPa at 09:00 and 1012 hPa at 12:00. The change is minus 6 hPa over three hours. If a forecast then shows 1008 hPa at 18:00, that final value is a prediction, not another observation. Check the update time before combining the information.
Neither the 1012 hPa measurement nor the three-hour drop determines exactly when rain will begin. Pressure is one part of weather interpretation alongside fronts, wind, moisture, and the local forecast. For outdoor safety, use official warnings rather than a barometer alone.
Try a practical pressure check
Choose one location and compare the same pressure type at two recorded times. Note the units, elevation context, and whether each value was measured or forecast. This simple exercise is more useful than collecting numbers from several apps without checking what they represent.
In Barometer, supported-device readings can be saved in history and annotated with notes. A note such as 'moved uphill after lunch' can explain a change that would otherwise look mysterious. Forecast charts provide a separate view of the hours and days ahead.
To explore without a phone sensor, use the website's city tools below. The Today tool focuses on the current value and a seven-day graph; Forecast provides the longer outlook. Both use weather-provider data rather than accessing a barometer in your browser.