Read direction, change, and time together
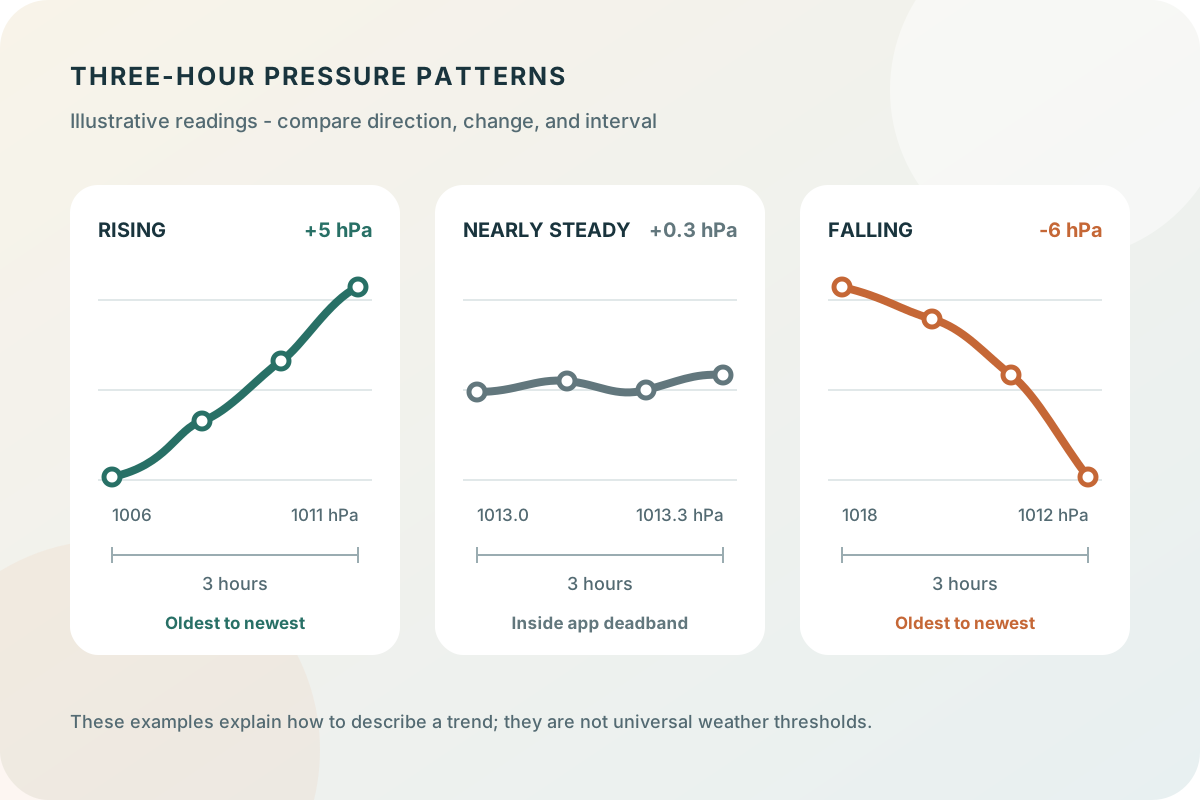
Direction is the simplest part: the ending value is above, below, or close to the starting value. Magnitude is the difference between those values. The interval tells you how quickly that change occurred. For example, 1006 to 1011 hPa over three hours is a rise of 5 hPa; 1018 to 1012 hPa over the same period is a fall of 6 hPa.
The illustrated steady trace moves from 1013.0 to 1013.3 hPa. That does not mean every point is identical; it means the net change is small within this example window. Avoid inventing a universal 'important change' threshold from the illustration. The meaning of a trend depends on local weather, measurement quality, and the task you are planning.
| Readings | Net change | Plain-language description |
|---|---|---|
| 1006, 1007, 1009, 1011 hPa | +5 hPa | Rising over three hours |
| 1013.0, 1013.2, 1013.1, 1013.3 hPa | +0.3 hPa | Nearly steady over three hours |
| 1018, 1017, 1015, 1012 hPa | -6 hPa | Falling over three hours |
How Barometer labels a three-hour tendency
Barometer's tendency indicator uses sea-level-pressure measurements from the previous three hours. It needs at least four measurements, then compares the oldest and newest values in that window. A change of at least 0.5 hPa is labeled upward or downward; a smaller change remains steady. The deadband helps prevent tiny changes from repeatedly flipping the indicator.
That product rule explains the arrow shown by the app; it is not a scientific boundary between meaningful and meaningless weather. The history graph contains more detail than the label, so inspect the curve when the timing or shape of a change matters. Pressure alerts use their own longer window and threshold and should not be confused with the tendency indicator.
Check pressure type, elevation, and data quality
Pressure at the device normally decreases as elevation increases. If you ride an elevator, drive uphill, or hike during the comparison window, a raw pressure curve can move even if the larger weather pattern changes very little. Sea-level pressure uses altitude to make readings from different elevations easier to compare, but it is an estimate and can also shift if the altitude input changes.
Use one pressure type across the full interval. Look for gaps, abrupt single-point spikes, or movement that coincides with a floor or elevation change. A smooth line is not automatically atmospheric evidence, and a jagged line is not automatically bad data; the surrounding context is what lets you investigate the difference.
Key takeaways
- Describe a trend with a direction, a pressure change, and a time interval.
- Compare the same pressure type throughout the window; elevation changes can distort raw device pressure.
- A measured trend documents what happened locally. It does not replace a weather forecast or warning.
Connect the measured trend to weather context
Pressure tendency is one part of weather analysis. The National Weather Service explains that pressure commonly falls ahead of a cold front and rises after it passes, but a phone curve alone cannot identify the front, its timing, or its hazards. Compare the local trace with wind, clouds, precipitation, radar, and the official forecast for your area.
Keep the tense clear: app history records what the sensor and calculation produced; a forecast describes expected future conditions. If the curve prompts a safety decision, check current watches and warnings. The pressure graph is useful supporting context, not an emergency alerting system.
Use notes to preserve the missing context
A later graph does not remember that you drove over a mountain pass, moved the phone between floors, saw a front arrive, or changed a plan. Add a short note when one of those details matters. Over time, the combination of values and observations is more useful than trying to reconstruct the day from the curve alone.
Review repeated situations before drawing conclusions. Similar-looking pressure traces can occur in different weather setups, and one coincidental event is not enough to establish a dependable pattern. Notes make the record easier to question, not just easier to confirm.