The difference in one example
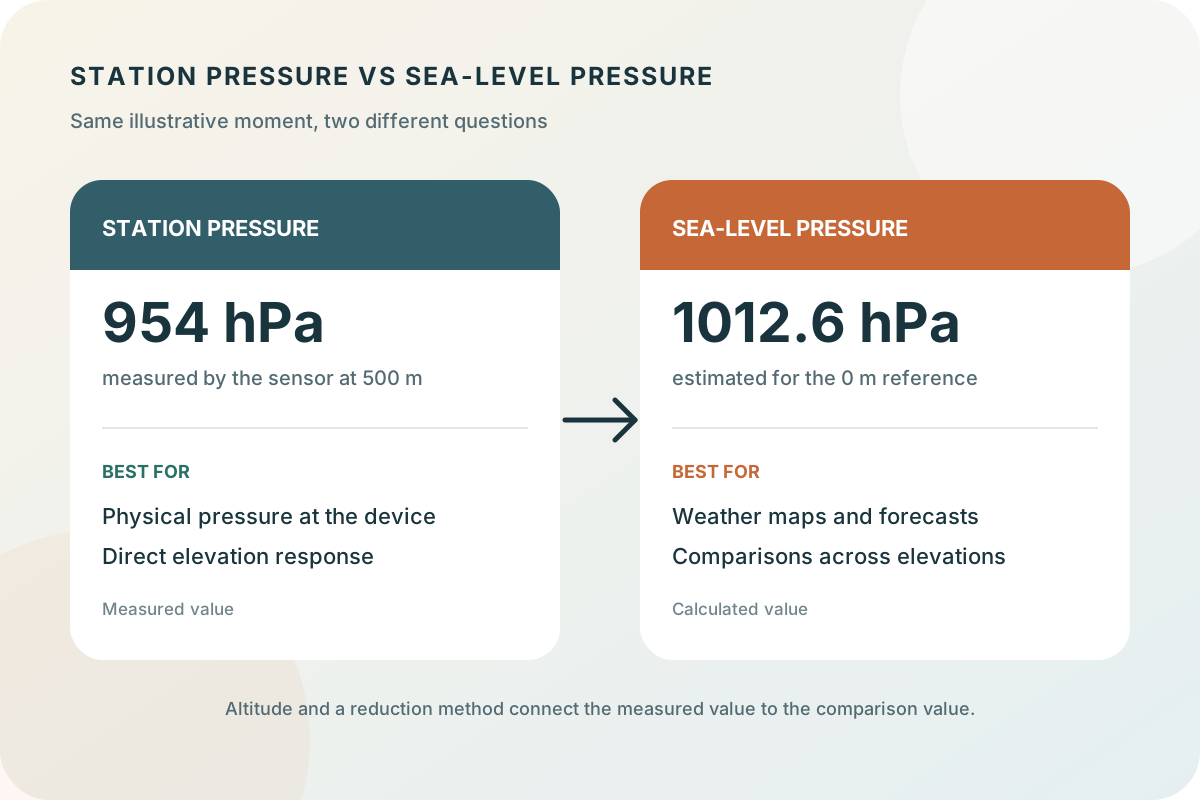
Suppose a device at 500 metres measures 954 hPa. That 954 hPa is station pressure: the pressure surrounding the device at its actual height. Applying Barometer's standard-atmosphere approximation produces about 1012.6 hPa at sea level. Both numbers can describe the same moment because they answer different questions.
The example is illustrative, not a claimed observation. The adjustment depends on altitude and formula, so another service may publish a slightly different sea-level result. The raw sensor value should not be expected to equal the adjusted weather-map value at an elevated location.
| Pressure type | Example value | What it describes |
|---|---|---|
| Station pressure | 954 hPa | Measured pressure at 500 m |
| Sea-level pressure | 1012.6 hPa | Calculated equivalent at 0 m |
Key takeaways
- Station pressure is measured; sea-level pressure is derived from a measurement and elevation context.
- Weather maps generally use sea-level pressure so terrain does not dominate the pattern.
- Barometer's sensor history and tendency use its sea-level-pressure estimate; Forecast is separately downloaded weather-provider data.
Use station pressure for the local physical measurement
Station pressure is the right concept when you need the pressure actually present at the instrument's elevation. It responds directly when the instrument moves vertically: carrying the same sensor uphill generally lowers the reading because less atmosphere is above it. That response is useful in altimetry and sensor analysis, but it can obscure regional weather comparisons.
Some APIs and displays use the term surface pressure for pressure at the local surface. Confirm the provider's definition rather than assuming every label is interchangeable. Altimeter setting is also a separate aviation-derived value and should not be silently substituted for either station pressure or mean sea-level pressure.
Use sea-level pressure for weather comparison
Sea-level pressure is usually the appropriate choice for comparing a device with a weather map, a forecast discussion, or stations at different elevations. Reducing observations to a common level allows regional highs and lows to reflect atmospheric patterns rather than the shape of the terrain.
It remains an estimate. A phone altitude, station elevation, temperature assumption, and reduction formula can all affect the result. Compare the broad level and trend after aligning the time and location; do not use a decimal-level mismatch as automatic proof of a sensor fault.
What Barometer records and displays
On supported devices, Barometer receives a local pressure measurement and combines it with altitude to calculate sea-level pressure. The app's displayed sensor value, saved history, pressure-change calculations, and three-hour tendency use that sea-level estimate. Changing from hPa to inHg changes the unit, not the pressure type.
The app's Forecast feature is a separate data path. It downloads weather-provider values for a selected place and future time rather than extending the phone's sensor curve into the future. Previously downloaded forecasts may remain visible offline, while fresh forecast data requires a network connection.
A practical decision table
Name the job before choosing a value. If a source does not state its pressure type, look for documentation or compare it with a nearby official observation before using it in a calculation.
| Task | Use | Why |
|---|---|---|
| Physical pressure at the sensor | Station pressure | No elevation reduction |
| Regional weather map | Sea-level pressure | Common comparison elevation |
| Compare places at different heights | Sea-level pressure | Reduces terrain's effect |
| Investigate movement uphill or downstairs | Station pressure | Shows the direct elevation response |
| Compare Barometer with a forecast | Sea-level pressure | Matches the app's comparison-oriented display |