Why anglers watch changes, not just numbers
An isolated reading is rarely enough to explain a trip. What matters more is whether pressure has been stable, falling, or recovering. That direction helps place the day inside a weather pattern. A slow fall may line up with a front building. A stable line may fit a quieter weather stretch. A rebound may help explain why the post-front day feels different from the day before.
This is why pressure changes get more attention than one static number. Change gives you motion and timing. It tells you whether the atmosphere has been doing something worth noticing while you were getting ready, traveling, or already on the water.
Key takeaways
- A pressure change is most useful when it helps you read timing and weather setup, not when it is treated like a bite predictor.
- Fronts, wind, water temperature, and tide or current often matter as much as the pressure curve.
- This page is about how to interpret the change, not about finding one perfect number or one perfect logging template.
What a falling, rising, or steady curve can suggest
A falling curve often gets the most attention because it can line up with an approaching front or more active weather. A rising curve may fit a more settled pattern or a post-front recovery. A steady curve can be useful too because it provides a calmer baseline for the rest of your decisions. None of those patterns are guarantees. They are clues about what kind of day you may be working with.
The practical difference is how you respond. On a steady day, you may lean more on structure, light, and seasonal behavior. On a day with a more obvious pressure shift, you may check the sky more often, pay closer attention to timing windows, or treat the trip like a day that may change mood faster than it looked at launch.
Why fronts and local conditions matter more than pressure alone
Pressure only becomes meaningful when it is interpreted with the rest of the environment. Wind can reposition bait and affect boat control. Water temperature can change how active fish are and where they hold. Cloud cover can alter light levels and feeding windows. Tide and current can dominate the story in many coastal and inshore situations. Front timing can change how urgent any of those other variables feel. Pressure fits into that mix rather than sitting above it.
This is also why anglers from different waters can reach different conclusions about the same pressure pattern. They may not be disagreeing about the graph itself. They may be fishing different seasons, different species, and different water types where other factors change how much the pressure shift actually matters.
Why pressure sometimes matters less than expected
Pressure tends to get too much credit when a trip goes well and too much blame when it does not. Sometimes the more decisive variable is simply that water temperature changed, bait moved, wind repositioned fish, or timing was off. That does not make pressure irrelevant. It just means the signal is often weaker than the myth around it.
Treating pressure as one variable protects you from overfitting every outcome. It also makes your notes more honest. You stop asking the graph to explain everything and start asking whether it helped clarify the conditions enough to improve your decisions.
How to use the graph as a context check
Before and during a trip, learning to read the pressure trend can turn the graph into a useful context check. Are you dealing with a quiet stable day, a front that is building, or a rebound after change? That question helps you decide how much weight to give the rest of the weather picture and whether the day deserves more frequent checks.
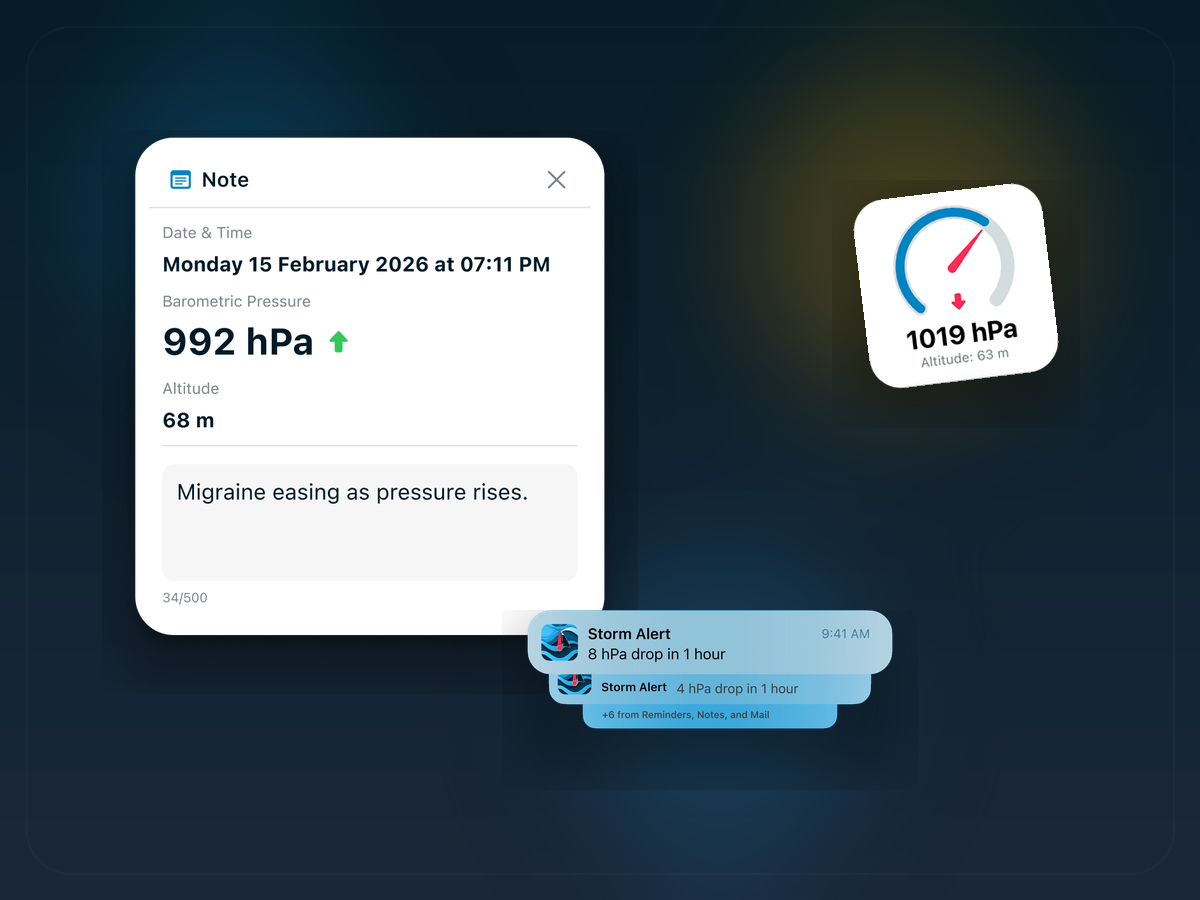
That is where Barometric Pressure fits well. The app gives you a local record, a visual trend, and notes you can attach to what the day really felt like. Used consistently, that is enough to turn pressure from lore into something you can actually compare trip to trip.