Start with the last few hours, not the current value
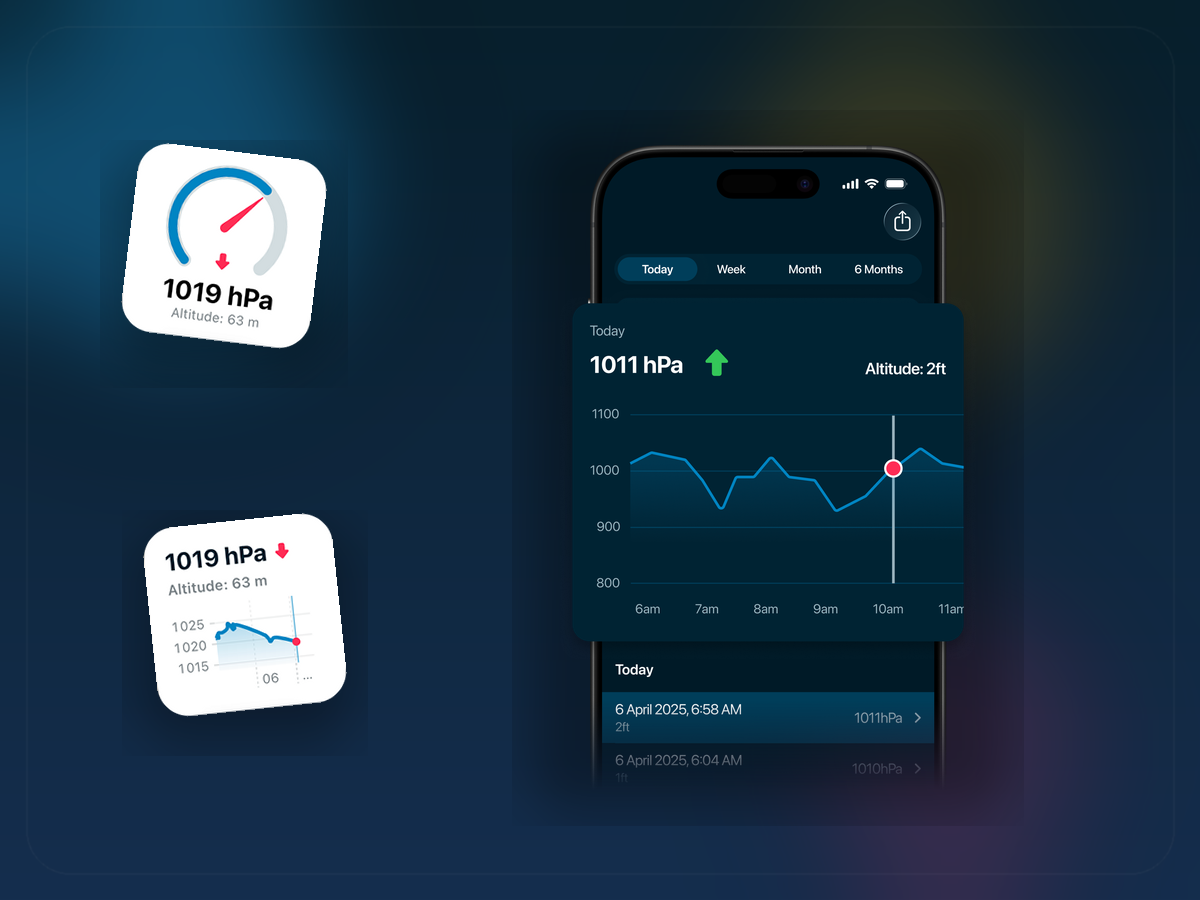
Before departure, open the graph and read the pressure trend across the last few hours rather than staring at the current number in isolation. A flat or gently rising curve may support a steadier interpretation of the morning. A sharper drop deserves a second look, especially if the forecast already hinted at a front, stronger breeze, or more unstable conditions later in the day.
This is where the barometer adds value to a sailing routine. It gives you a local trend that may reveal whether the atmosphere has been quiet, changing slowly, or moving faster than the dockside conditions suggest at that moment.
Compare the graph with the forecast you already trust
The forecast remains the bigger weather picture. The pressure trend helps you decide whether the local setup feels consistent with that forecast or whether it deserves more caution. If the forecast looks manageable but the local pressure has been dropping quickly, that may be enough to shorten the route, leave earlier, or keep an escape option more front of mind.
If the pressure trend looks quiet and consistent with the forecast, that can support confidence too. Either way, the graph is not replacing judgment. It is sharpening it.
Use a short checklist before you cast off
A useful routine can stay very short. Check the pressure trend, compare it with wind and cloud movement, think about the route’s exposure, and decide how much margin you want in the day. If the day already looks weather-sensitive, set an alert so you do not have to keep reopening the app once you are underway.
That kind of checklist keeps the barometer in the right role. It is part of seamanship and weather awareness, not a stand-alone green light or red light.
Key takeaways
- Check the recent pressure trend before departure, not just one static number.
- Use the graph to confirm or question the forecast picture you already trust.
- Save short notes after meaningful sailing days so your next check becomes smarter.
Keep notes after the days that stand out
The most valuable notes are usually short: a squall line arrived earlier than expected, a return leg felt rougher than the morning suggested, or the day stayed cleaner than forecast. Those details attached to the pressure graph build local memory over time. That is especially useful if you sail the same coastal area or launch point often.
After a few saved days, the next pressure check becomes more grounded. You are no longer reading the graph in theory. You are comparing it with your own history of what similar curves meant on the water.